
Mr. Dostert's Domain


Supply & Demand
How Markets Work
Markets essentially are based on the relationship of two fluctuating forces which interact constantly: Supply and Demand. These two economic forces combine to answer each of the three predominant economic questions. All goods and services are affected by all sorts of changes in the market from income, technolgical innovation, the change in consumer preferences, etc. By analyzing how Supply and Demand interact we are able to better understand the problem of choice and how choices really play out in the real world.

Demand
In a market system, buyers demand goods and sellers supply those goods at a price both groups agree to. This principle is simple, but how it plays out can be confusing. Simply put, Demand is the desire to own something and the ability to pay for it. This means that although I would like to own a helicopter, I do not demand it because I do not have the ability to pay for it.
The Law of Demand
The law of demand is a basic principle of economics which says tht when a good's price is lower, consumers will buy more of it. When the price is higher, consumers will buy less of it. We see this principle played out in our lives daily as we make choices based on prices and alternatives availible to us. This relationship creates a curve that will always slope downward.
Demand Curve


The general pattern of the law of demand is the result of two separate patterns which overlap: the substitution effect and the income effect. These effects describe two different ways tht a consumer can change his or her spending patterns and explain why an increase in price decreases the quantity purchased.
The Substitution Effect
The substitution effect is seen when there is more than one option availible to consumers in a market. It describes how when the price of a good rises above a certain level consumers become more likely to buy one of the alternatives as a substituted for the original good. For example, if the price of pizza increases I may be inclined to purchase a hamburger instead because the hamburger is a substitute good for the pizza.

The Income Effect
The income effect is a relationship seen in the damand for goods based on an increase or reduction in an consumer's income. For a normal good, when there is an increase in real income that an individual makes the greater amount that individual will purchase of the good. This works fundamentally the same when there is a decrease in a consumer's income which causes him or her to buy less of that good. However what is less often recognized is the way the income effect influences the purchase of inferior goods. When dealing with an inferior good an increase in income will result in a decrease in consumption because the consumer is driven to buy the higher quality product. Once more the reverse is true, as income decreases there is an increase in the consumption of inferior goods as the consumer is driven to buy the lower quality product in order to better budget their spending.


Income
Demand

Income

Demand
Normal Good
Inferior Good
Other Factors

Beyond substitutes and income there are several other factors which can influence demand such as needs, preferences, habits, the price of complements, as well as consumer expectations. We will see how these effect demand when we look at shifting the demand curve.
Supply
In a market system, sellers sellers are driven to produce goods at a quantity that benefits them greatest. Supply is the amount of goods available in a market. This number will fluctuate based on market conditions to meet the demand of consumers.
The Law of Supply
The law of supply states that the higher the price the larger the quantity producers will be inclined to produce. When prices are higher, producers will produce more of that good. When the price is lower, producers produce less. Economists use the term quantity supplied to describe how much of a good is offered at a specific price. This relationship creates a curve that will generally slope upward.
Supply Curve


Other Factors
Some other factors that can influence supply are the availibility of factors of production, the costs of the factors of production, technology, taxes, subsides, and weather or natural factors. We will see how these effect supply when we look at shifting supply curves.


Combining Supply & Demand
By combining Supply and Demand we are able to understand how a market works. When a demand schedule is graphed we see a downward sloping curve. The supply curve on the other hand slopes upward. When those curves are combined we find a point where demand and supply come together, this point is known as equilibrium. Equilibrium is the point of balance between price and quantity. At equilibrium the market for a good is stable.

Disequilibrium
If the market price or quantity supplied is anywhere but at the equilibrium, the market is in a state of disequilibrium. Disequilibrium can produce one of two outcomes, excess demand or excess supply.

Excess Demand
The problem of excess demand occurs when quantity demanded is more than quantity supplied. When the actual price in a market is below equilibrium price excess demand is created because low prices encourage buyers and discourage sellers creating a shortage.


If the price is too high then the market will face a problem of excess supply. The high prices in this scenario encourage sellers to produce more and more but discourages customers from buying pizza since it is too expensive. The result of excess supply is a surplus in which too much of a good is made and the extras are wasted.
Excess Demand
Government Intervention

Markets naturally are driven toward equilibrium by the invisible hand, however in some cases the government steps in to control prices. Intervention can come in two forms a price ceiling, or a price floor.
Price Ceilings
A price ceiling is a maximum price, set by law, that sellers can charge for a good or service. The government places price ceilings on some goods that are considered "essential" and might become too expensive for some consumers. An example of this is rent control. In New York as well as several other cities across the United States local governments have experimented with rent control to prevent inflation from making the cost of rent on apartments from getting too high and driving poor families from their neighborhoods.

When we graph the price ceiling we see that by establishing a price ceiling the demand is increased and the supply will decrease as sellers leave the market because it is no longer as profitable. In turn the price ceiling will create an artificial shortage.


A price floor is a minimum price, set by law that sellers can charge for a good or service. The government sets price ceilings as a way to protect producers to make sure that they are rewarded for their effort. An example of this is minimum wage. In the factor market individuals sell their labor to entrepreneurs in exchange for monetary compensation. If left unchecked, these entrepreneurs would rarely increase their pay scale leading to a low standard of living for workers in the market. By setting a minimum wage, workers are guaranteed a standard of living for the work they do.
Price Floor
A price floor will create a surplus as demand is lower and supply increases. In the example of minimum wage, more people are willing to work and the supply of labor rises, however the number of businesses willing to hire decreases and the demand for their labor will decrease.


Shifting Supply & Demand

As we have already seen when we looked at Demand and Supply independently, there are several factors which will cause the curve to shift. When the two market forces are combined we can see how the shifts will affect prices.
Shifting Demand
We can see from the charts below that when we have a demand decrease we see both a decrease in price and quantity. When we have a demand increase there is an increase in both price and quantity.


Shifting Supply
When the Supply Curve shifts we can see that a decrease in supply results in a price increase and an quantity decrease. A Supply increase leads to a price decrease and quanity increase.


Elasticity
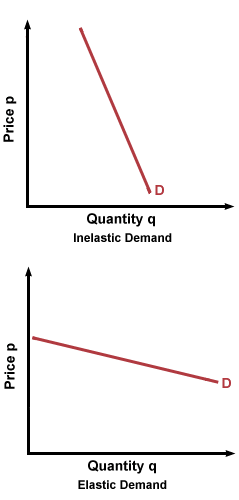
In markets the law of demand shows us how as price rises the demand for a good decreases. However, this relationship varies greatly depending on which good is being exchanged. Some goods have will show extreme change in demand based on a small price change, while others show very little. This is because different goods have different levels of elasticity. Elasticity is the relationship between price and demand and how responsive consumers are to price changes.
Elastic Demand
A good is said to have elastic demand when a change in price has a high impact on the demand for that good. Goods that have elastic demand are generally not necessary and have many available substitutes that consumers can choose instead. An example of a good with high elasticity is fast food. Because there is a wide variety of substitutes in the market, prices are very competitive and a small increase in price would lead to a large decrease in sales.
Inelastic Demand
A good is said to have inelastic demand when a change in price has a low impact on the demand for that good. Goods that have inelastic demand are generally necessities and have few available substitutes that consumers can choose instead. An example of a good with low elasticity is gasoline. Because most people need gasoline to get to work and there is no real substitute in a market, changes in prices have very little effect on sales.


Values of Elasticity
The terms inelastic and elastic have precise mathematical definitions which can be used to describe their value. If the elasticity of demand for a good at a certain price is less than one, we describe demand as inelastic. If the elasticity is greater than one, demand is elastic. If elasticity is exactly equal to one, we describe demand as unitary elastic. When elasticity of demand is unitary, the percentage change in quantity demanded is exactly equal to the percentage change in the price.



Calculating Elasticity
Elasticity is determined using the following formula:


Example


Costs of Production and Marginal Gains
One of the essential questions that any business has to answer is how many workers to hire. To answer this question, entrepreneurs consider how the number of workers they hire will affect their total production. When we look at how much additional production a single worker adds, we are looking at the marginal product of labor.

In our example just as in real life we see that the marginal product of labor is not constant when we add additional workers. At certain points of production we see increases which are higher than others. This generally occures because adding additional workers allows workers to specialize and therefore become more efficient as they become more skillful ath their assigned tasks. This can be seen fully in development of an assembly line in which one worker performs one single specialized task repeatedly to perform at peak efficiency.
Marginal Product of Labor
Increasing/Diminishing Returns

When hiring additional workers and output increases more than hiring the previous worker, the firm is experiencing what is known as increasing marginal returns. On our chart this is seen at points B through D. However at a certain point, hiring output will not increase as much by hiring additional workers. At this point the firm is experiencing diminishing marginal returns. Although the firm is still increasing output it is at a lower rate because the benefits of specialization end. On our chart this can be seen in points E through H. Finally if we continue hiring workers eventually there is a point where hiring workers will actually decrease output. If this occurs a firm is experiencing negative marginal returns. On our chart this occurs at point I.
Production Costs

Economists divide a producer's costs into two categories: fixed costs and variable costs.
Fixed Costs
A fixed cost is a cost that does not change, no matter how much of a good is produced. Most fixed costs involve the production facility and the cost of building and equipping a factory. Examples of fixed costs include rent, machinery, property taxes, and salaries of workers who keep the business running even when production stops.
Variable Costs
Variable costs are costs that rise or fall depending on the quantity produced. They include the costs of raw materials some labor. These are the costs a firm incurs in the process of production. When a firm produces more it will have higher variable costs, and when a firm produces less it will have lower variable costs.


Total Cost
When fixed costs and variable costs are combined we find the total cost of production. By identifying total cost we can find the level of profit.
TC = FC+VC
Marginal Cost
Marginal cost is the additional cost of producing one more unit.

Competition and Monopolies
Competition allows consumers to get the products they want at prices they can afford. This is because if one producer does not meet the demands of consumers they can easily find substitutes. This also means that when prices are too high for one producer's goods consumers will purchase the cheaper substitute. Competition therefore means that consumers are not setting their own prices, the market is setting the price for them. However this scenario is rarely in effect because different markets have different levels of competition which causes the market to play out in ways that are not quite as simple as supply and demand.

Perfect competition
A perfectly competitive market is one with a large number of firms all making essentially the same product. Because there are so many firms in the market, the extreme competition forces all of the fims to sell the same product at the same price. However, each firm produces so little of the product compared to the total supply thant no single firm can influence prices on its own. The only choice such producers can make is how much to produce, given their production costs and the market price which they are forced to accept. Often goods with perfect competition are comodities- products that are the same regardless of who makes and sells it. Examples of comodities are milk, gasoline, eggs, paper, etc.


Monopolistic Competition
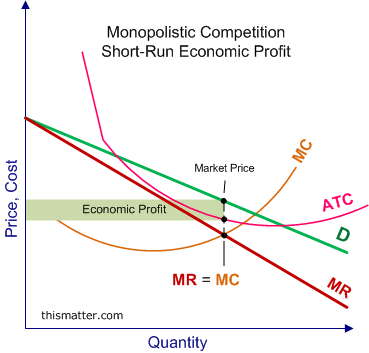

Most markets exist in a state which has imperfect competition or monopolistic competition. This means that it is the only product of its kind, however there are similar alternatives which can be purchased. An example of imperfect competition is seen in Cola. Coca-Cola is the only product that has its particular formula for cola, however there is an alternative which is slightly different in Pepsi. In the short-run monopolistic competition will act much like a monopoly, however as more substitutes are created the price will have to change as the demand for the product decreases. The major difference is seen in the differentiation which enables sellers to profit from the differences between his or her products and the competitor's products.
Monopolies
A monopoly forms when there is a single seller in the market. There are four conditions for a monopoly to exist: one firm, no variety of goods, complete barrier to entry into the market, and complete control over the price. Monopolies tend to favor the producer and cause consumers to pay a higher cost than the market would bear if supply and demand were allowed to find a point of equilibrium. There are several causes for monopolies. A natural monopoly is a market in which it does not make sense to allow competition. Government monopolies also prevent competition when the government creates barriers of entry to create an artificial monopoly to reward certain groups. These often come in the form of patents, franchises, or licenses.

Monopolies allow producers to produce at the level which benefits them greatest rather than the amount which satisfies demand. The point where this will happen is where marginal revenue meets marginal costs. The price however will be set where the demand for this level of production is, increasing the level of profit for the producer. This will cause some people who legitimately demand the good to be unable to get the good. These people are referred to as deadweight loss. In certain circumstances the monopolist may be able to divide consumers into two or more groups and charge a different price to each group. This practice is known as price discrimination. The most common example of price discrimination is with flights for airlines. By charging a premium rate for flights the nearer to the date allows the airlines to charge those with a higher demand the higher price and those with lower demand a lower price and thereby maximize their profits.


Oligopolies
An oligopoly describes a market dominated by a few large, profitable firms. An Oligopoly looks like an imperfect form of monopoly. Acting on their own or as a team, the biggest firms of an oligopoly will set prices higher and out put lower than in a perfectly competitive market. This collusion presents a challenge to government, because oligopolistic firms often set prices and bar competing firms from the market which can become just as damaging to the consumer as a monopoly through practices such as price fixing.

The ultimate form of an oligopoly exists in the form of a cartel, an agreement by a formal organization of producers to coordinate prices and production. Cartels can only survive if every member keeps to its agreed output levels and no more. Otherwise, prices will fall, and firms will lose profits. The most famous cartel is OPEC which sets production and prices for oil for many countries in the Middle East which gives them great power and control over the market.


Regulation and Deregulation
The government has the power to regulate business and has taken action to prevent the formation of monopolies through the creation of antitrust laws to ensure fair competition in markets. On several occasions the government has sued companies which it believes uses predatory pricing to drive competition from the market including Microsoft.
Since the late 1970s and 1980s, Congress passed laws to deregulate several industries. Deregualtion means that the government no longer decides what role each company can play in a market and how much it can charge its customers. Deregulation allows for an increase in competition by eliminating barriers and price controls in the hopes that the increased competition will result in lower prices and better products for consumers.
Resources
Freakonomics Introduction



Demand in Cinema
The Hudsucker Proxy
Supply & Dance!

Supply & Demand in Cinema
Indiana Jones


Incentive in the Market
Producers Incentives
In a free market we see that producers are motivated by profit, that is the benefit gained by making an economic decision. Profit is determined by measuring revenues, compared to the costs of the action. Because the incentive of all individuals in a free market is to maximize their own profit, decisions will be made accordingly.

Profit = Revenue - Costs

Understanding that this drive for profit is the incentive allows us to predict the behavior of suppliers in the market. We can see in the chart that the pofit is is the space between the revenue and costs at the point of equilibrium of a supply and demand chart.
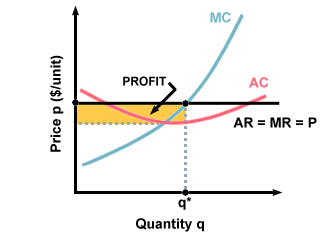

As profit increases the desire to supply increases following the law of supply.
Consumers Incentive
Despite this seemingly simplistic understanding that producers are motivated by profit, individual consumers have other incentives that can influence their behavior. These factors can be cultural, social, or simply individual preference. Economists look at these behaviors and attempt to understand causality in order to better understand a market. What we find is seemingly straight forward solutions are rarely as simple as they seem. To better understand incentive our class will be watching Freakonomics based on the book by economist Steven Levitt and journalist Stephen Dubner.


